Bottleneck Calculator 2026 | Check CPU & GPU Balance
Last Updated: October 2026
Building a PC or planning an upgrade? A bottleneck calculator tells you whether your CPU and GPU are well matched — before you spend a single dollar. Select your processor, graphics card, memory, resolution and workload above, and you'll get a bottleneck percentage, a system health score and concrete upgrade advice in seconds. Free, no signup, no download.
You may also see this kind of tool called a bottle neck calculator or simply a bottleneck calc — same idea, different spelling. Whatever you call it, the question it answers is the same: is one of my components holding the rest of my PC back?
What Is a Bottleneck Calculator?
A bottleneck calculator is a free online tool that estimates how balanced your PC's core components are. It compares the relative performance of your CPU (processor) and GPU (graphics card) — along with your RAM, display resolution and intended workload — and identifies which part is most likely to limit the others.
The concept is simple. Your PC is only as fast as its slowest critical component in any given task. If you pair a powerful graphics card with a weak processor, the GPU spends part of every frame waiting for the CPU to finish its work. That waiting is the bottleneck: paid-for performance you never get to use. The reverse happens too — a strong CPU tied to an old GPU will sit partially idle while the graphics card struggles.
A bottleneck calculator quantifies that mismatch as a percentage. A low percentage means your parts complement each other; a high percentage means one component is seriously holding the other back, and your money would be better spent rebalancing the build than upgrading blindly.
What "bottleneck" means in a PC
In PC terms, a bottleneck is any component that caps the performance of the rest of the system under a specific workload. It is not a fixed property of a part — it's a property of a combination doing a particular job. The same CPU and GPU pairing can be perfectly balanced at 4K and badly bottlenecked at 1080p, because resolution changes where the work lands. That's why any serious bottleneck test asks for your resolution and workload, not just the two part names.
Bottleneck calculators for laptops vs. desktops
Everything in this guide applies to laptops, with three extra wrinkles:
- Names lie (a little). A laptop "RTX 4070" is not a desktop RTX 4070 — mobile chips are cut-down versions with lower power limits. Our database lists laptop variants as separate entries with their own scores. Always pick the exact laptop part, never the desktop namesake.
- Thermals dominate. Thin chassis throttle sooner, which means a laptop's sustained bottleneck can be worse than its paper bottleneck. If your laptop's real performance trails the estimate, heat is the prime suspect — cooling pads and vent clearance are free performance.
- Upgrades are limited. You usually can't swap a laptop CPU or GPU, so the calculator's value shifts from "what should I buy?" to "is this laptop well-balanced before I buy it?" and "which settings should I use?" Run the checklist before purchase, not after.
When not to use a bottleneck calculator
A tool is most useful when you know its edges. Skip the calculator — or take its output lightly — in these cases:
- You already own the parts and something feels wrong. Measure the actual machine instead (see above). A calculator estimates from a parts list; monitoring tools report what's really happening. When they disagree, trust the measurement.
- Exotic configurations. Multi-GPU setups, heavy overclocks with custom cooling, workstation cards doing gaming duty — the database models mainstream combinations, and edge cases deserve real benchmarks.
- Non-gaming bottlenecks you can't quantify this way. "Is my PC fast enough for 4K video editing?" depends on codecs, timelines and software more than on a CPU/GPU ratio. The calculator's content-creation workload helps, but editing performance is genuinely harder to reduce to a number.
- As a purchase justification. If you've already decided to buy the shiny GPU and just want a number that agrees with you, you'll find a way to read it that way. Run the numbers before you fall in love with the part.
Who should use one
- First-time builders checking a parts list before ordering — the classic "is my CPU bottlenecking my GPU?" question.
- Upgraders deciding whether the CPU or the GPU should be replaced first for the biggest gain.
- Budget shoppers making sure a cheap CPU doesn't waste a good GPU deal (or vice versa).
- Curious owners who want to understand why their PC stutters in some games but not others.
What a bottleneck calculator can't do
Honesty matters here, so let's be clear about the limits. No calculator — ours or anyone's — can give you an exact FPS number for a specific game. Real performance depends on cooling, drivers, power limits, background apps, game engines and even the silicon lottery. What a good calculator can do is rank the balance of a combination reliably: it will correctly tell you that pairing A is far more lopsided than pairing B, and which side to fix first. Treat the percentage as a planning guide, not a laboratory measurement. Our methodology section explains exactly how the estimate is built.
Where the "bottleneck" idea comes from
The word wasn't born in PC building — it comes from manufacturing. In Eliyahu Goldratt's Theory of Constraints, a bottleneck is the slowest station on a production line: the whole factory's output equals whatever that one station can process, and speeding up any other station changes nothing. PC builders adopted the metaphor because a gaming PC is exactly that: an assembly line where the CPU prepares each frame and the GPU renders it, and the slower stage sets the pace for everything.
The metaphor also explains the most common beginner mistake. In a factory, you'd never buy a faster machine for a station that isn't the bottleneck — yet PC builders do the equivalent constantly, dropping a flagship GPU into a system whose processor was already the limit. The calculator exists to prevent exactly that purchase.
Bottleneck calculator vs. bottleneck checker vs. bottleneck test
Search around and you'll meet half a dozen names for the same idea: bottleneck calculator, bottleneck checker, bottleneck test, pc bottleneck calculator, bottleneck calc. They all describe one thing — a tool that estimates whether your parts are balanced. The names differ; the question doesn't.
The one distinction worth knowing: some sites use "test" to mean a downloadable benchmark you run on your own PC (measuring your machine directly), while a "calculator" estimates from a component database (predicting a planned machine). Ours is a calculator: it answers "would this combination work?" before you buy, which is when the answer is most valuable. If you already own the parts, monitoring tools (see how to confirm a bottleneck yourself) measure your actual machine — the two approaches complement each other.
Why a percentage beats a yes/no answer
Some tools just say "bottleneck: yes" or "bottleneck: no." That's nearly useless. Every PC has some limiting component under some workload — a yes/no answer just tells you that physics exists.
A percentage lets you do three things a yes/no can't:
- Compare options. Is the Ryzen 5 7600 + RTX 4060 Ti build better balanced than the i5-14400F + RX 7700 XT build? 9% vs 22% answers that instantly.
- Prioritize spending. A 35% bottleneck screams "fix me now"; a 12% one says "fine for now, plan ahead." Same word ("bottleneck"), totally different urgency.
- Track changes. Re-run after an upgrade and watch 34% become 7% — proof the money worked.
That's why everything on this site is expressed as a number with a named band, never a bare yes or no.
How to Use the Calculator
Using the tool takes under a minute. Here's each step:
1. Select your CPU
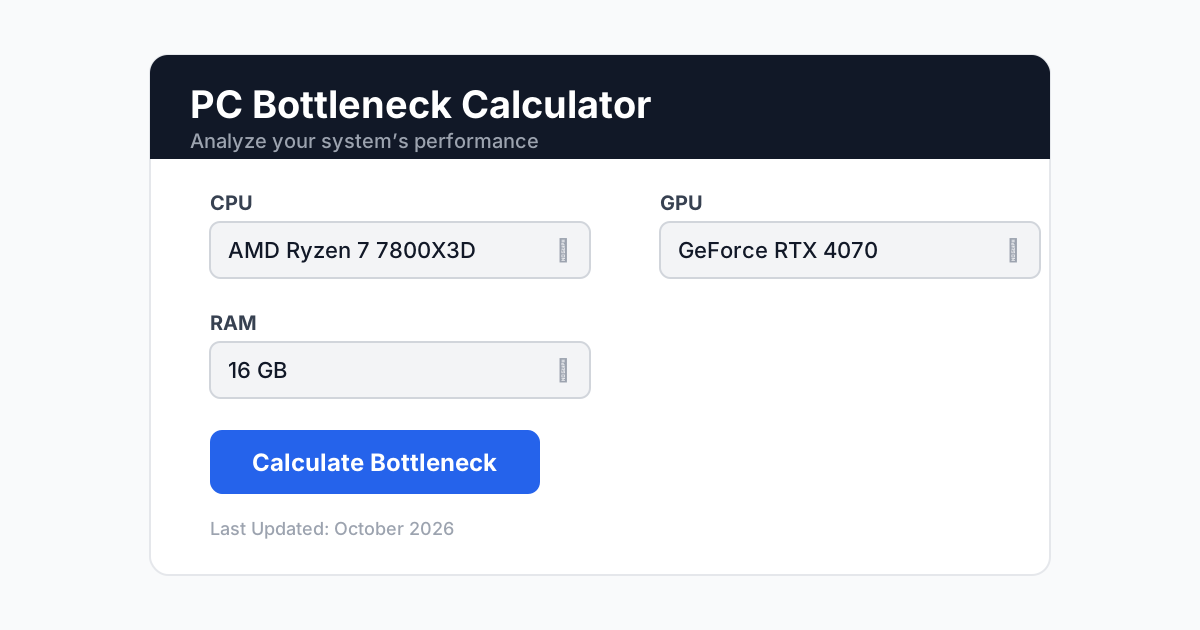
Open the CPU dropdown and pick your processor. The list holds hundreds of models from AMD, Intel and Apple — desktop and laptop chips — grouped by brand. If you're planning a build and don't own the CPU yet, select the one you're considering buying. That's the whole point: test before you buy.
2. Select your GPU
Do the same in the GPU dropdown. Dedicated graphics cards, integrated graphics and laptop GPUs are all listed. Unlike some older tools, our database includes current-generation cards — including the desktop RTX 40 and 50 series and recent Ryzen chips that other calculators are missing.
3. Select your RAM
Choose your memory capacity: 8, 16, 32, 64 or 128 GB. RAM rarely decides a bottleneck on its own, but 8 GB in a gaming build in 2026 is a genuine constraint, and the calculator accounts for it.
4. Open Advanced Options (recommended)
Click Show Advanced Options for the inputs that separate a rough guess from a useful estimate:
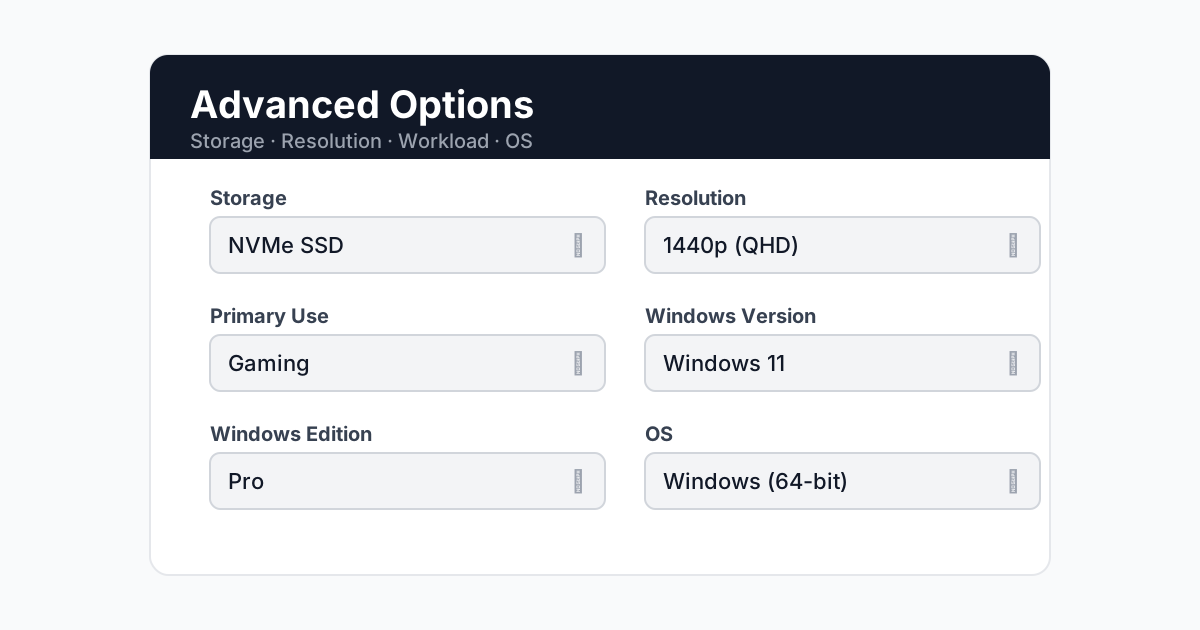
- Storage — HDD, SSD or NVMe. Mostly affects loading, not frame rates, but it's part of the full picture.
- Display Resolution — 1080p, 1440p, 4K or 8K. This one matters enormously (more below).
- Primary Use — Gaming, Content Creation, Programming, General Use, Streaming or AI/ML. A pairing that's fine for office work can be badly bottlenecked for gaming.
- Windows version / edition / OS — recorded for the system summary; minor effect on the estimate.
5. Hit "Calculate Bottleneck"
The Calculate Bottleneck button activates once CPU, GPU and RAM are chosen. The analysis runs instantly, entirely in your browser — nothing is uploaded anywhere.
6. Read your results
You'll get a status banner, a bottleneck percentage, a health score, utilization charts, a side-by-side comparison and tailored recommendations. The next section explains exactly how to read each of those.
7. Download or share your report
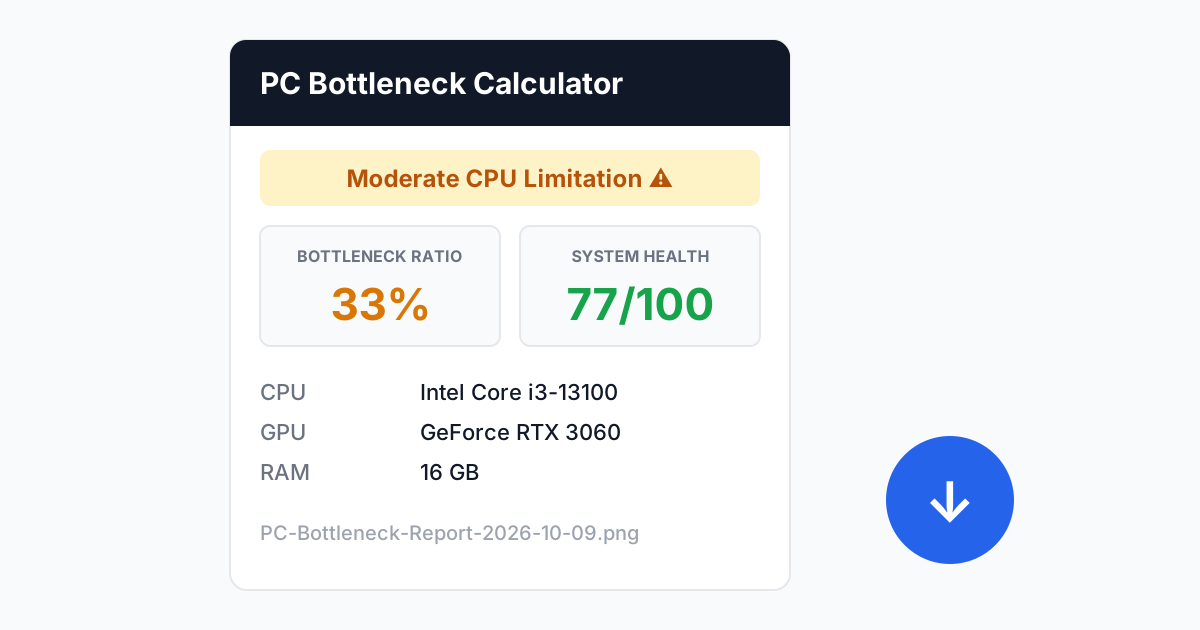
Use Download Report to save your results as a dated PNG image — handy for forum posts ("is this build balanced?") or comparing before-and-after an upgrade. Share Results copies a link that re-runs your exact configuration when opened.
Tips for the most accurate result
The estimate is only as good as the inputs. Five habits that matter:
- Pick the exact model. "RTX 3060" and "RTX 3060 Laptop GPU" are different chips with different scores — the database lists them separately for a reason. Laptop owners: always choose the laptop variant.
- Use the resolution you actually play at. Testing at 4K when your monitor is 1080p produces a flattering but fictional result.
- Set the real workload. A pairing that's balanced for office work can be badly bottlenecked for streaming the same games — the workload changes which side matters.
- When between two options, test both. Choosing between 16 GB and 32 GB of RAM, or two candidate GPUs? Run both configurations and compare the health scores. That's the calculator's best use.
- Don't sweat the Windows fields. Version and edition are recorded for the system summary; they barely move the estimate. Fill them in for completeness, not accuracy.
The advanced options, field by field
Storage (HDD / SSD / NVMe SSD). Honest placement: this barely moves the bottleneck percentage, because storage affects loading rather than frame rendering. So why ask? Because the System Info summary and the upgrade advice are more useful when they're complete — and because a builder on a spinning HDD in 2026 should know that an SSD is the highest-impact quality-of-life upgrade available, even if it doesn't change their FPS.
Display Resolution (1080p / 1440p / 4K / 8K). The highest-impact advanced field, as covered above. If you take one thing from this guide: always calculate at the resolution you actually use. A result computed at the wrong resolution is worse than no result, because it's confidently wrong.
Primary Use (Gaming / Content Creation / Programming / General Use / Streaming / AI-ML). This re-weights the estimate toward the component your workload stresses. Gaming and streaming lean on the CPU (frame preparation, encoding); content creation and AI/ML lean on the GPU (rendering, compute). Two identical part lists can legitimately get different verdicts here — a video editor and a competitive gamer genuinely need different balances.
Windows version, edition, and OS. Recorded for the System Info tab and the downloadable report. They have a negligible effect on the estimate itself — Windows 11 vs 10 won't change your bottleneck band — but a complete system summary makes forum help ("here's my full config") far more useful.
What if your part isn't listed?
The database covers hundreds of CPUs and GPUs — including current-generation desktop and laptop parts that older calculators miss — but hardware launches never stop. If your exact model isn't there yet:
- Pick the closest tier sibling (e.g., an RTX 4070 Super stands in well for a 4070 Ti in most estimates).
- Check the Last Updated date under the tool — the database is rebuilt from fresh benchmark aggregates whenever significant new hardware launches.
- Re-run your configuration after the next update; your shared results link makes that a ten-second job.
How to Read Your Results
The status banner
Every result starts with one of three verdicts:
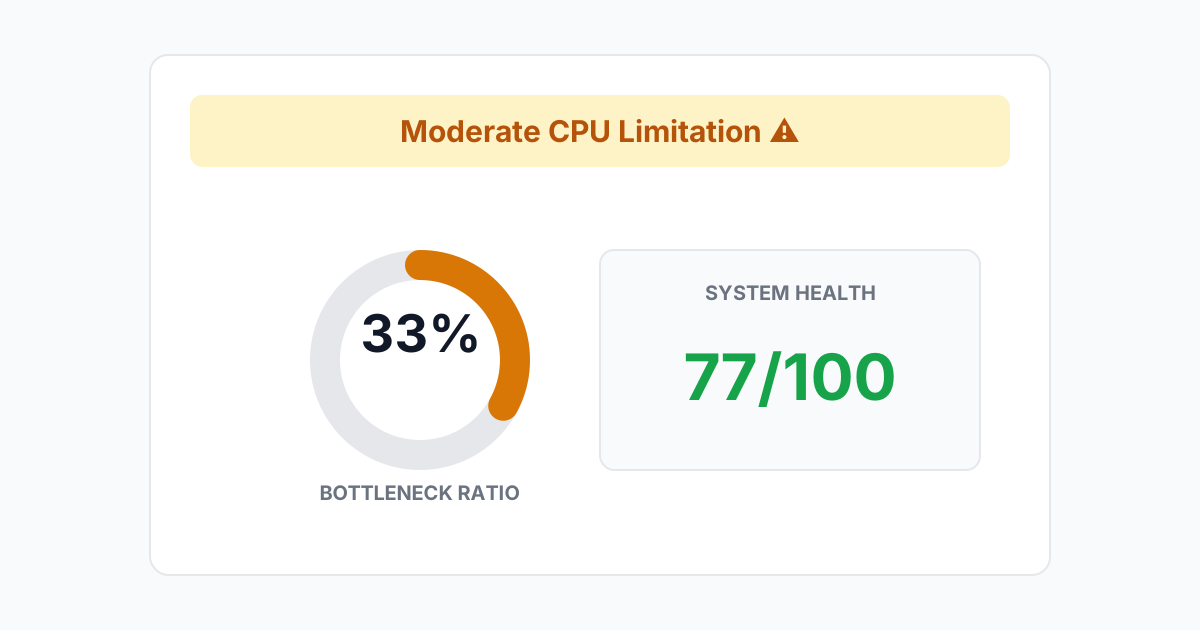
- Balanced Build ✓ (green) — bottleneck under 10%. Your components complement each other. No urgent changes needed.
- Moderate {CPU|GPU} Limitation ⚠ (orange) — bottleneck between 10% and 30%. One side reaches its limit noticeably earlier. Worth optimizing settings; consider which side to upgrade next.
- High {CPU|GPU} Limitation ❌ (red) — bottleneck above 30%. One component is severely holding the other back. Rebalance before spending more on the strong side.
The named component is the limiter — the part doing the holding back.
Bottleneck Ratio
The donut shows the estimated bottleneck percentage: roughly, how much of the stronger component's potential is being left unused because of the weaker one. A few landmarks:
- Under 10% — excellent. Chasing 0% is not worth money; even perfectly matched parts show small variances.
- 10–20% — common in real builds, especially budget ones. Noticeable only in demanding scenes.
- 20–30% — the "should I fix this?" zone. Worth addressing if you're upgrading anyway.
- Over 30% — a genuine mismatch. Upgrading the strong component further would be wasted money until the limiter is fixed.
System Health Score
A 0–100 summary of the whole configuration's balance and headroom. Think of it as the opposite lens on the same data: high bottleneck percentage means a lower health score. Use it to compare two candidate builds at a glance — the higher score is the better-balanced machine.
The three tabs
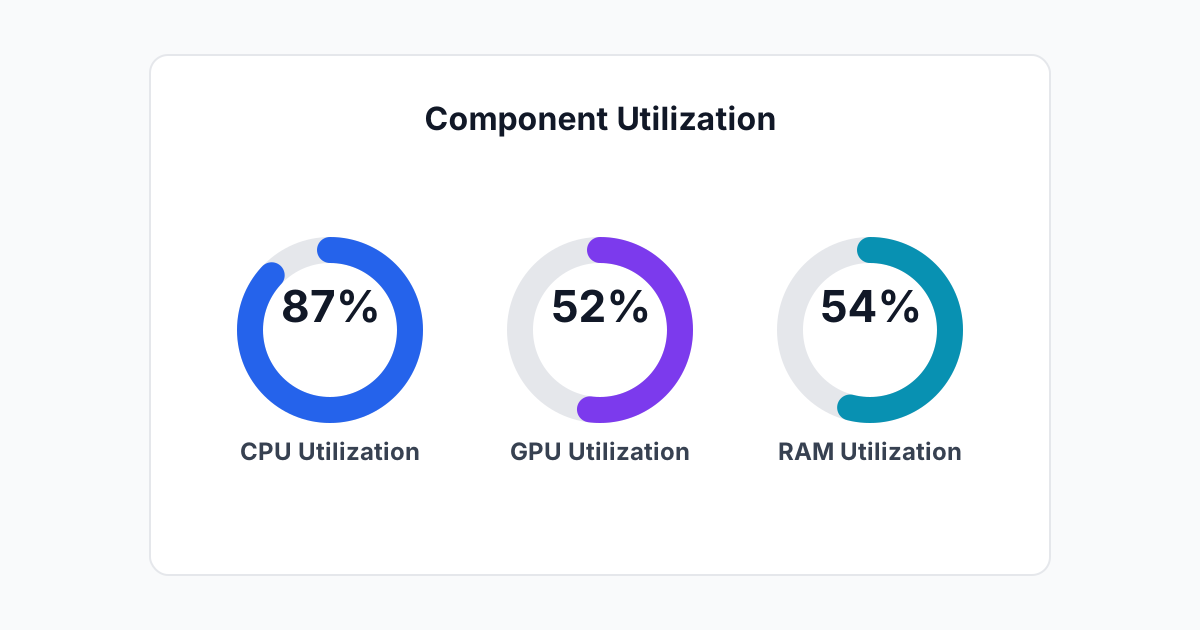
- Utilization — estimated load share for CPU, GPU and RAM under your chosen workload. If the limiter sits near 90%+ while the other side idles at 50%, you can see the bottleneck.
- Comparison — your CPU and GPU scores side by side on our 0–100 component scale. A wide gap is the visual form of the bottleneck percentage.
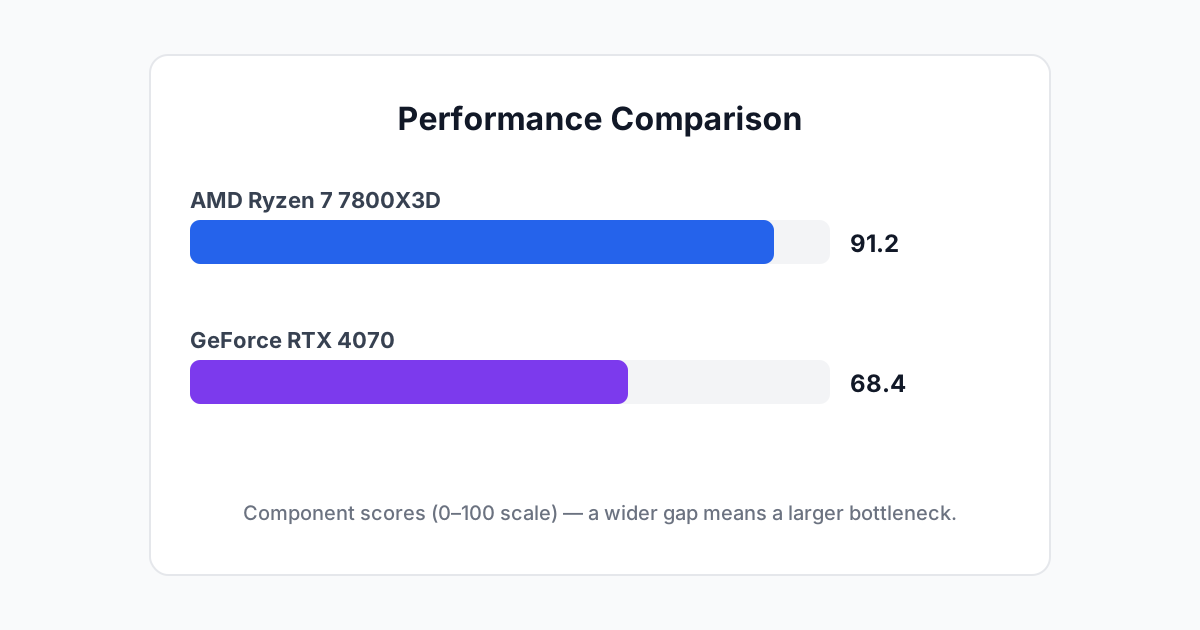
- System Info — a clean summary of everything you entered. Useful for screenshots and forum questions.
Optimization & Upgrades
This is where the result becomes actionable, in three parts:
- Immediate Fixes — free steps first: driver updates, enabling XMP/EXPO memory profiles, closing background apps, power and cooling checks. A surprising number of "bottlenecks" are really stale drivers or a suffocating dust filter.
- Upgrade Paths — which component to replace first, including a specific suggested model from our database that's roughly a tier above your limiter, plus the resolution-shift trick (explained below).
- Optimal Settings — how to configure the system you have: which settings to raise or lower depending on which side limits you.
Sharing and comparing builds
Two features turn a one-off calculation into a planning workflow:
Compare candidates side by side. Run build A, note the bottleneck percentage and health score. Hit Analyze Another Configuration, run build B, compare. The higher health score is the better-balanced machine — no expertise required. This is the fastest way to choose between two parts lists, two prebuilt PCs, or "upgrade now vs. wait" options.
Share the link, not a screenshot. Share Results copies a URL that re-runs your exact configuration when opened — CPU, GPU, RAM, resolution, workload, everything. Paste it into Reddit, Discord, or a forum instead of a screenshot, and anyone who opens it can tweak your inputs to test their own suggestions ("what if you dropped to a 7600X?"). It turns advice threads from guesswork into experiments. The downloadable PNG report covers the cases where you need a static image — a build log, a marketplace listing, or your own records.
What to do in each band
Balanced Build (under 10%) — Enjoy it. Don't "fix" what isn't broken: spending to shave a 6% bottleneck to 3% buys you nothing you'll ever feel. When you eventually upgrade, upgrade both sides together to stay balanced. Put the money toward the monitor, the SSD, or your savings.
Moderate Limitation (10–30%) — Start free. Work through Immediate Fixes (drivers, XMP/EXPO, background apps, cooling) and the Optimal Settings for your limiter side; those alone often recover several percentage points of real performance. Then plan: your next paid upgrade goes to the named limiter, not the strong side. A moderate bottleneck is also the ideal time to try the resolution-shift trick — bumping to 1440p or enabling DLSS Quality can visibly shrink a CPU-side bottleneck for zero dollars.
High Limitation (over 30%) — Stop upgrading the strong side immediately. Every dollar spent on the already-strong component is wasted until the limiter is addressed. Example: a 40% CPU bottleneck with an RTX 4070 means a 4070 Ti would perform nearly identically in your system — the CPU must be replaced first. Follow the Upgrade Paths section's specific suggestion, which is picked from the database as the smallest sensible step up.
CPU vs GPU Bottlenecks Explained
This is the heart of the matter — and the source of most confusion. Let's make CPU and GPU compatibility concrete.
What each part actually does in a game
Think of every frame as a two-stage assembly line. The CPU does the preparation: game logic, physics, AI, draw calls (instructions telling the GPU what to draw), and background tasks. The GPU does the rendering: turning those instructions into the actual pixels — textures, lighting, shadows, reflections.
The frame can only finish when both stages are done. Whichever stage is slower sets the pace. That's the entire theory of bottlenecks in one paragraph.
CPU bottleneck: the processor can't keep up
A CPU bottleneck happens when the processor prepares frames more slowly than the graphics card can render them. The GPU ends up waiting — you can often see this as low GPU usage (say 50–60%) while one or two CPU cores are maxed out.
Classic scenario: an Intel Core i3-13100 paired with an RTX 3060 at 1080p. Our calculator puts this around a 33% CPU limitation — the graphics card has far more to give, but the processor can't feed it fast enough. This is the single most common bottleneck in budget gaming builds, and it's why "is my CPU bottlenecking my GPU?" is one of the most searched questions in PC building.
Signs you're CPU-bottlenecked:
- GPU usage stays well below 100% while gaming
- Lowering resolution or graphics settings barely changes your FPS
- Frame drops in busy scenes (crowds, physics, large battles)
- A much stronger GPU gives only a small FPS gain
GPU bottleneck: the graphics card can't keep up
A GPU bottleneck is the mirror image: the processor prepares frames faster than the graphics card can render them. Here the GPU sits near 100% usage while the CPU has headroom to spare.
Classic scenario: a Ryzen 7 7800X3D — one of the fastest gaming CPUs available — paired with an old GTX 1650. The CPU is barely trying; the GPU is the wall. Our calculator flags this as a high GPU limitation, and the fix is obvious: the graphics card is the upgrade.
Signs you're GPU-bottlenecked:
- GPU usage pinned near 100%, CPU comfortably below
- Raising resolution or graphics settings tanks your FPS sharply
- Lowering settings gives a big, immediate FPS boost
Note something important: a GPU bottleneck is often fine. If you're gaming at 4K with high settings, you generally want the GPU to be the limit — it means your CPU isn't wasting money. "Bottleneck" sounds bad, but a mild GPU limitation at high resolution is the sign of a sensible build.
Why resolution changes everything
Here's the key insight most builders miss: the same CPU+GPU pairing has a different bottleneck at every resolution.
At 1080p, frames are cheap to render, so the GPU finishes quickly and waits on the CPU — CPU bottlenecks dominate. At 4K, each frame is enormously expensive to render, so the GPU becomes the limit even with a modest CPU. Competitive esports players at 1080p low settings are almost always CPU-limited; cinematic single-player gamers at 4K ultra are almost always GPU-limited.
Our calculator models this explicitly: select 1080p and the estimate weights the CPU side; select 4K and it weights the GPU side. If your result shows a CPU limitation at 1080p, try switching the resolution to 1440p or 4K in the tool and watch the bottleneck shrink — that's not a trick, it's physics. It's also a legitimate optimization: playing at a higher resolution (or using DLSS/FSR Quality mode) shifts work onto an underused GPU.
A worked example
Take a mid-range 2026 build: Ryzen 5 5600 + RTX 4060, 16 GB RAM, 1080p, Gaming.
- CPU score vs GPU score: close enough that neither side dominates.
- Result: Balanced Build, bottleneck in the single digits, health score in the 90s.
- Recommendation: no changes needed — spend future upgrade money on both sides together.
Now swap the CPU for an i3-13100 keeping the same RTX 4060:
- Result: Moderate-to-High CPU Limitation, bottleneck in the 30s.
- Recommendation: the CPU is the limiter; a drop to a Ryzen 5 5600-class chip (or enabling higher resolutions to load the GPU) restores balance.
Two builds, one part changed, completely different advice. That's what a bottleneck test is for.
Compatibility isn't just "will it work"
When people search "cpu gpu compatibility" or "gpu and cpu compatibility", half of them mean physical compatibility (socket, power, drivers) and half mean performance compatibility — will these two parts make sense together? Our tool answers the second question. For the first, the short version: any modern CPU works with any modern GPU at the PCIe level; the real compatibility question is always about balance. A $1,500 GPU in a $120-CPU system "works" — it just wastes most of its potential.
If you're shopping for a processor to match a card you own (or vice versa), our guides to the best gaming CPUs and the best graphics cards for gaming are built around exactly this balance question.
Bottleneck myths worth retiring
Myth 1: "Any bottleneck is bad." Every system has a limiting component somewhere — that's physics, not failure. A 6% GPU limitation at 4K is a good build. The goal was never zero; it's knowing where the limit sits and whether it matters for what you do.
Myth 2: "Expensive parts can't bottleneck." Price doesn't balance a system; matching does. A $1,500 GPU paired with a $120 CPU is one of the worst bottlenecks you can build. Money spent on the wrong side is just an expensive way to learn the assembly-line lesson.
Myth 3: "Bottleneck calculators are useless." The serious version of this complaint is that percentages aren't lab measurements — which is true, and which our methodology section says openly. But "not a lab measurement" and "useless" are very different claims. A calculator that consistently ranks build A as more balanced than build B, names the right limiter, and suggests the right upgrade has done its job. Dismissing the tool because it isn't a benchmark is like dismissing a map because it isn't the territory.
Myth 4: "You need perfect CPU-GPU 'compatibility' as a spec." There's no official compatibility rating between a given CPU and GPU — no certification, no standard. "Compatibility" in the performance sense is just balance, and balance is exactly what the percentage measures. Anyone selling you a more mystical version is selling something.
(We go deeper on each of these in our PC bottleneck myths guide.)
The resolution decision guide: 1080p vs 1440p vs 4K
Since resolution moves the bottleneck more than almost anything else, choosing the right one for your hardware is a skill. Here's the practical guide:
1080p — the competitive gamer's resolution. Frames are cheap, refresh rates are high (144–360 Hz monitors are affordable), and the CPU does the heavy lifting. Best when: you play esports or fast shooters, you own a mid-range GPU, or high FPS matters more than eye candy. Warning: this is where CPU bottlenecks bite hardest — a weak processor is fully exposed at 1080p.
1440p — the sweet spot for most gamers in 2026. Noticeably sharper than 1080p, far less demanding than 4K, and modern mid-range GPUs (RTX 4060 Ti / RX 7700 XT class and up) handle it well. Best when: you want a balance of visuals and performance on a single monitor. CPU bottlenecks relax here; the load splits more evenly.
4K — the cinematic choice. Four times the pixels of 1080p, and the GPU becomes the limit in nearly every build — which, as discussed, is fine. Best when: you have a high-end GPU (RTX 4070 Ti / RX 7900 XT class and up), you play story-driven games, or your monitor/TV is 4K native. A modest CPU is perfectly acceptable here; don't overspend on the processor for a 4K rig.
How to choose: start from your monitor's native resolution — running non-native always looks worse. Then check your GPU class against the list above. Then run the calculator at that resolution. If it reports a CPU limitation above 20% at 1080p, either accept it (competitive settings favor CPU headroom anyway) or consider 1440p — the monitor upgrade that fixes a bottleneck without touching the PC.
Types of PC Bottlenecks
CPU-vs-GPU gets the headlines, but it's not the only way a PC can choke. Here's the full taxonomy, condensed — each with what it feels like.
1. CPU bottleneck
Covered above: the processor can't feed the GPU fast enough. Feels like low GPU usage, stutter in busy scenes, and FPS that ignores your graphics settings. Fixed by a stronger CPU — or by raising resolution to give the GPU more to do.
2. GPU bottleneck
Covered above: the graphics card is the wall. Feels like FPS that scales directly with graphics settings. Fixed by a stronger GPU — or by lowering settings and resolution.
3. RAM bottleneck
Too little memory (or slow, single-channel memory) forces the system to shuffle data to disk, which is orders of magnitude slower. Feels like stuttering when entering new areas, sluggish alt-tabbing, and disk activity spikes during gameplay. In 2026, 16 GB is the practical gaming minimum; 8 GB is a real bottleneck in modern titles. Also check that XMP/EXPO is enabled — RAM running at JEDEC defaults can cost you 10%+ in CPU-limited games for free.
4. Storage bottleneck
A spinning HDD (or a nearly-full SSD) delays level loads, texture streaming and boot times. Feels like long loading screens and texture pop-in, but — important — it rarely affects average FPS once a level is loaded. An NVMe SSD is the single best quality-of-life upgrade for an old system, even though it won't raise your frame rate.
5. Thermal bottleneck
When a CPU or GPU gets too hot, it silently slows itself down to survive — thermal throttling. Feels like great performance for the first ten minutes that gradually decays, or benchmark scores that drop on repeat runs. Fixed with cleaning, better airflow, repasting, or simply not blocking your laptop's vents. Monitoring temperatures is free; ignoring them is expensive.
6. Network bottleneck
Not a PC-component issue, but it ruins the experience identically: high ping, packet loss and jitter feel like stuttering and delayed inputs in online games. If your FPS is fine but the game feels laggy, suspect the connection before the hardware. Wired ethernet beats Wi-Fi for gaming, every time.
7. Power (PSU) bottleneck
An undersized or aging power supply can't deliver clean power under load, causing crashes, restarts or throttled boost clocks that masquerade as other bottlenecks. Rule of thumb: size your PSU with 30–40% headroom over the system's peak draw, from a reputable unit. Our PSU tier list ranks units worth trusting with expensive hardware.
How to confirm a bottleneck yourself
The calculator estimates; these free tools measure your actual machine. Use them to verify:
MSI Afterburner + RTSS overlay — the enthusiast standard. It draws live CPU (per-core), GPU, RAM and frame-time graphs over your game. The diagnosis reads itself: GPU pinned at 99% while CPU cores loaf → GPU-limited. One or two CPU cores maxed while the GPU sits at 60% → CPU-limited. Per-core view matters — total "CPU 40%" can hide two saturated cores.
Windows Task Manager / Xbox Game Bar — press Ctrl+Shift+Esc, Performance tab, and watch CPU/GPU utilization during gameplay. Cruder than Afterburner but already installed. Game Bar (Win+G) adds an FPS counter and a lightweight overlay with no setup.
The two-minute resolution test — no software needed. Note your FPS, then drop the resolution one step (e.g., 1440p → 1080p):
- FPS jumps substantially → you were GPU-limited (the graphics card was the wall).
- FPS barely changes → you were CPU-limited (the processor was already the wall).
Run this test, then run the same parts through the calculator. When estimate and measurement agree — and they usually do — you can plan the upgrade with confidence.
The upgrade order of operations
When the calculator flags a real bottleneck, work in this order — cheapest and most reversible first:
- Diagnose precisely. Note the limiter side, the band, and the percentage. Screenshot or download the report; you'll compare against it later.
- Apply every free fix. Drivers, XMP/EXPO, background apps, power plan, cooling, the resolution-shift trick. Re-run the calculator inputs mentally — these don't change the parts, but they change real performance, sometimes by 10%+.
- Upgrade the limiter, and only the limiter. Pick the smallest sensible step up (the tool suggests one). Resist the urge to "future-proof" the strong side — that's how bottlenecks are born.
- Re-test. Run the new combination through the calculator. The percentage should drop into a lower band; the health score should rise. If it didn't, something else is going on — thermals, drivers, or a misidentified limiter.
- Stop at Balanced. Once you're under 10%, stop spending on balance. Further money goes to the monitor, peripherals, games, or savings — not to chasing 3%.
Follow that loop and you'll never again buy a part that your system can't use.
Which bottleneck should you fix first?
Real systems often have more than one. Prioritize like this:
- Thermals first. If anything is throttling, no parts swap matters until cooling is fixed — a throttled flagship performs like a mid-range card while costing flagship money. Free to diagnose, cheap to fix.
- The named limiter second. Whatever the calculator flags at the highest percentage is your best dollar-for-dollar upgrade.
- RAM third. If you're at 8 GB (or single-channel), it's cheap, easy, and removes a whole category of stutter.
- Storage last for FPS purposes — first for quality of life. An SSD won't raise frame rates, but if you're still booting from a spinning drive in 2026, fix that for your own sanity regardless of what any calculator says.
Our Methodology: How This Calculator Works
We'd rather show our work than ask for your trust. Here's exactly what happens when you press Calculate.
Where the numbers come from
Every CPU and GPU in our database carries a single performance score on a 0–100 scale. Those scores aren't invented — they're compiled from public benchmark aggregates (large multi-game test suites published by hardware reviewers), normalized so the fastest consumer GPU sits at 100 and everything else is placed relative to it. The database is refreshed as new hardware launches; the "Last Updated" date under the tool tells you how fresh it is.
How the estimate is computed
In plain language:
- Compare the scores. The gap between your CPU and GPU scores, relative to the stronger of the two, is the raw bottleneck figure. A 30-point gap on a 100-point scale is roughly a 30% bottleneck.
- Adjust for resolution. At 1080p the estimate weights the CPU side (frames are cheap to render, so the processor is usually the limit). At 4K and 8K it weights the GPU side (frames are expensive, so the graphics card is usually the limit). 1440p is neutral.
- Adjust for RAM and workload. 8 GB of RAM adds a penalty for gaming and content-creation workloads. Gaming and streaming workloads are CPU-sensitive; content creation and AI/ML are GPU-sensitive. These are small nudges, not dominant factors.
- Band the result. Under 10% → Balanced Build. 10–30% → Moderate Limitation on the weaker side. Over 30% → High Limitation.
What we honestly can't promise
This is a planning estimate, not a lab measurement. Two identical part lists can perform differently because of cooling quality, driver versions, power limits, background software, BIOS settings, and the specific games you play. No online bottleneck calculator — ours included — can replace real benchmarks for an exact FPS figure.
What the estimate is reliable for: ranking combinations. If pairing A scores 8% and pairing B scores 35%, B is genuinely far more lopsided than A, and the named limiter is genuinely the side to address first. Use it to compare options and plan upgrades — that's what it's built for.
Why we're different from older calculators
- Current hardware included. Many calculators still lack desktop RTX 40/50-series cards and modern Ryzen chips. Ours has them.
- No signup, no tracking. The calculation runs entirely in your browser. Your configuration never leaves your device.
- Transparent method. This section exists. Most competitors publish a percentage with no explanation of where it came from.
Limitations and margin of error
No honest methodology section skips this. Treat our percentage as accurate within roughly ±5–10 points, and understand what moves real results away from the estimate:
- Silicon lottery and cooling. Two "identical" builds differ: better cooling sustains higher boost clocks, so a well-cooled system beats the estimate slightly and a hot one trails it.
- Drivers and game engines. A new driver or a badly optimized game patch can shift real performance 10%+ in either direction overnight. The estimate reflects typical, current conditions.
- Laptop power limits. Laptop chips share thermal and power budgets with the whole chassis; two laptops with the same CPU can perform differently. Our laptop scores are conservative averages.
- Background software. Streaming, recording, browsers with fifty tabs — all tax the CPU in ways no parts-list calculator can see.
None of this makes the estimate useless; it makes it what it claims to be — a planning guide. The ranking of options (build A is more balanced than build B) remains reliable even when absolute numbers wobble.
How the database stays current
Hardware doesn't stand still, so neither does the data underneath the tool. The component database is rebuilt from fresh public benchmark aggregates whenever significant new hardware launches — new GPU generations, new CPU architectures, major laptop refreshes. Each rebuild re-normalizes the 0–100 scale, so a score from 2026 means the same thing as a score from 2025.
The Last Updated date under the calculator tells you exactly how fresh the data is. If your part launched last week and isn't listed yet, check back after the next refresh — and use the closest tier sibling in the meantime.
Frequently Asked Questions
Is a 10% bottleneck bad?
No. Under 10% is our "Balanced Build" band — it means your components complement each other well. Chasing 0% is not worth money: even perfectly matched parts show small variances between workloads, and the cost of eliminating the last few percent almost never pays back in real performance. If your result is under 10%, spend your upgrade budget elsewhere (or save it).
What is a good bottleneck percentage?
Anything under 10% is excellent, 10–20% is normal for real-world builds (especially budget ones), and 20–30% is the zone where you should think about which side to upgrade next. Above 30%, one component is genuinely holding the other back, and rebalancing will give you more performance per dollar than any other upgrade.
Can a bottleneck damage my PC?
No. A bottleneck is a performance inefficiency, not a hardware fault. Your components won't be harmed by being mismatched — the stronger part simply waits for the weaker one. The only "damage" is to your wallet: paid-for performance you never use. (Overheating is a separate issue — that's thermal throttling, not a bottleneck per se.)
Does RAM cause bottlenecks?
It can, but it's rarely the primary limiter. 8 GB in a 2026 gaming build is a genuine constraint — you'll see stuttering and heavy disk activity as the system pages memory to storage. 16 GB is the practical minimum for gaming today; 32 GB gives comfortable headroom for streaming and content creation. Also verify XMP/EXPO is enabled in BIOS: RAM stuck at JEDEC speeds can cost 10% or more in CPU-limited games, and the fix is free.
Is my CPU bottlenecking my GPU?
That's exactly what the calculator above answers — select both parts and check which side the tool names as the limiter. As a quick rule of thumb: if your GPU usage stays well below 100% while gaming but your CPU (or individual cores) runs hot, the CPU is the limiter. If the GPU is pinned near 100% while the CPU coasts, the GPU is the limiter.
Which is worse: CPU bottleneck or GPU bottleneck?
Neither is "worse" in absolute terms — it depends on your use case. A CPU bottleneck wastes GPU money and causes stuttery, inconsistent frame times, which feels bad. A GPU bottleneck at high resolution is often desirable: it means your CPU investment isn't wasted and you can fix performance with settings alone. Competitive gamers fear CPU bottlenecks; cinematic 4K gamers happily live with GPU bottlenecks.
Does bottleneck depend on resolution?
Enormously — it's one of the biggest factors. At 1080p, frames are cheap to render, so the CPU is usually the limit. At 4K, frames are expensive, so the GPU is usually the limit. The same CPU+GPU pairing can show a 25% CPU bottleneck at 1080p and a nearly balanced result at 4K. Always run the calculator at the resolution you actually play at.
How do I fix a CPU bottleneck?
Four options, cheapest first: (1) raise your resolution or enable DLSS/FSR Quality mode to shift load onto the GPU; (2) close background apps and enable XMP/EXPO; (3) overclock if your chip and cooling allow it — modest gains; (4) upgrade the CPU, ideally to something at least a tier above your current one. Our tool's Upgrade Paths section suggests a specific model from the database.
How do I fix a GPU bottleneck?
Lower the load on the graphics card: drop the resolution or render scale, reduce shadows and ray tracing first (they're the most expensive settings), switch DLSS/FSR to Performance mode, and update drivers. If settings don't get you there, the GPU is the upgrade — and your CPU likely has headroom for a much stronger card, which the calculator will confirm.
Will a bottleneck calculator tell me my FPS?
No — and be suspicious of any tool that claims to. FPS depends on the specific game, its engine, your settings, drivers, cooling and background software. What a calculator reliably tells you is relative balance: which side limits you and roughly how lopsided the pairing is. Use it to compare builds and plan upgrades, not to predict exact frame rates.
Are online bottleneck calculators accurate?
They're accurate at what they're designed for — ranking the balance of combinations — and misleading if you treat the percentage as a lab measurement. Ours is built on normalized public benchmark aggregates with a documented method (see above), which makes it consistent and comparable. Treat any calculator's number as a planning estimate with a margin of error, and it'll serve you well.
What does "bottleneck my PC" mean for upgrades?
It means: upgrade the limiter first. If your bottleneck is 35% CPU-side, a new GPU buys you almost nothing until the CPU is addressed — you'd be paying for performance that stays locked behind the processor. The general rule: fix the named limiter, then re-test. Balanced 10%-style builds should be upgraded on both sides together.
Do I need to worry about bottlenecks for office work or programming?
Almost never. Web browsing, office apps and most programming work don't stress either the CPU or GPU in ways where their relative balance matters — any modern pairing is fine. Bottleneck analysis matters for gaming, 3D rendering, video editing, streaming and AI/ML workloads, where one side can genuinely starve the other.
Can a weak CPU damage a good GPU?
No — a weak CPU cannot damage a graphics card. The GPU simply waits for work and runs below its potential. There's no electrical or thermal risk from the mismatch itself. The "risk" is purely economic: you're not getting what you paid for from the GPU until the CPU catches up.
Is 8GB RAM a bottleneck in 2026?
For gaming, increasingly yes. Modern titles plus Windows plus a browser or Discord in the background can exceed 8 GB, at which point the system pages to storage and you get stuttering. It's one of the cheapest bottlenecks to fix — a 16 GB kit is inexpensive and the calculator will show the penalty disappearing when you select it.
Does an SSD reduce bottlenecks?
An SSD massively improves loading times, boot times and texture streaming, but it rarely changes average FPS once a level is loaded. So: it eliminates the storage bottleneck (and it's the best quality-of-life upgrade for an old PC), but it won't fix a CPU or GPU bottleneck. NVMe over SATA is a smaller jump — nice, not transformative.
What is the best CPU-GPU combo to avoid bottlenecks?
There's no single answer — it depends on your resolution and budget. The principle: match tiers. A mid-range CPU (Ryzen 5 5600-class, i5-12400F-class) pairs well with mid-range GPUs (RTX 4060-class, RX 7600-class). High-end GPUs (RTX 4070 and above) deserve a strong CPU (Ryzen 7 7800X3D-class or better) to stretch their legs at 1080p/1440p. Run your exact shortlist through the calculator instead of guessing.
Should I upgrade my CPU or GPU first?
Upgrade whichever side the calculator names as the limiter. If neither side dominates (under 10%), upgrade the one that matters for your workload: GPU for higher resolutions and prettier settings, CPU for high-refresh competitive gaming and heavy multitasking. When in doubt, the GPU usually delivers the most visible gaming improvement per dollar — unless you're CPU-limited, in which case it's wasted.
Do laptop CPUs and GPUs bottleneck differently?
The mechanics are identical, but laptops add power and thermal limits that desktops don't have. A laptop GPU with the same name as a desktop card is typically a cut-down version, and sustained performance depends heavily on the machine's cooling. Our database includes laptop chips as separate entries with their own scores, so select the exact laptop variant for an honest estimate.
What is a GPU bottleneck at 4K?
At 4K it's usually the expected state, not a problem. Rendering four times the pixels of 1080p makes the graphics card the limit in almost any sane build — and that's fine, because it means your CPU isn't the constraint and you can tune performance purely with graphics settings. A 4K GPU "bottleneck" under ~20% is the sign of a well-planned build, not a mistake.
Can overclocking fix a bottleneck?
Partially. Overclocking the limiting component can shave a few percentage points off a mild bottleneck — typically 5–10% gains with good cooling. It won't fix a 35% mismatch, and it adds heat, noise and power draw. Think of it as a free small step while you plan a real upgrade, not a substitute for balanced parts.
Why does my FPS not improve after upgrading my GPU?
This is the classic symptom of a CPU bottleneck: the new graphics card is faster, but the processor was already the limit, so frames can't be prepared any quicker. Before upgrading, run the old and new GPU through the calculator against your CPU — if the bottleneck percentage barely moves or stays CPU-side, the money belongs in a CPU upgrade instead.
Does dual-channel RAM affect bottlenecks?
Yes, measurably in CPU-limited scenarios. Single-channel memory starves the processor of bandwidth, which matters most exactly when the CPU is the limiter — budget builds with one RAM stick can lose 10–20% in some games versus dual-channel. It's also one of the cheapest fixes: a matched pair of sticks instead of one.
How often should I re-check my bottleneck?
Re-check whenever you change any major component, switch your primary resolution or monitor, or shift workloads (e.g., from gaming to streaming or AI work). Also worth a re-run once a year: our component database updates as new hardware launches, so estimates get more accurate over time. Bookmark your results link — it re-runs your exact configuration.
Is this bottleneck calculator really free?
Yes — completely free, no account, no download, no paywalled "detailed report." The calculation runs in your browser, your configuration is never sent to a server, and the downloadable PNG report costs nothing. If you find it useful, the best thanks is sharing it with someone planning a build.